PROGRAM OVERVIEW
The Elite Software PsyChart program displays the psychrometric chart on the computer screen, and allows the designer to carry out all operations and analysis normally done using a conventional psychrometric chart. However, PsyChart is more than an electronic display of the standard psych chart. For example, it can quickly display numerical values of all properties for any selected point on the psych chart. Points on the psych chart can be labeled for future reference, and reports of their properties can be displayed on the screen or printer. Additionally, PsyChart allows psychrometric processes to be analyzed. The lines for all standard psychrometric processes, such as heating and humidification, cooling and dehumidification, mixing, collecting, etc., are displayed on the chart with simple user commands. Although the initial display is the standard ASHRAE sea-level chart, this can be changed by the user to show a chart for any elevation or pressure, and for any range of dry bulb temperatures. The user can further customize the psych chart by specifying to show or omit any of the property lines which can be displayed with either English or SI metric units. In order to view sections of the psych chart in fine detail PsyChart allows the user to zoom in and create an expanded "window" around the selected region of the psych chart. Windows enhance the clarity of processes where state points tend to crowd together. PsyChart can print reports and plot charts on dot matrix and HP Laser Jet printers. AutoCAD users can plot charts from the DXF files created.
DEMONSTRATION DISKS
If you would like to evaluate the PSYCHART program in further detail you can download a demonstration copy from our website, or order a copy, with complete documentation. The demonstration copies retain all the functionality of the full programs, they are just limited on the size of the project data that can be entered. Please follow this link for description of the demonstration limits for the PSYCHART program.
CALCULATION METHOD
The PsyChart program uses the psychrometric equations for moist air in Chapter 6 of the 1989 ASHRAE Handbook of Fundamentals. Rapidly converging iteration techniques have been employed to allow PsyChart to solve problems with virtually any combination of input parameters.
SYSTEM REQUIREMENTS
PsyChart can operate on any IBM-PC compatible computer using DOS 5.0 or higher with at least 512K of memory and a graphics monitor which can be color or monochrome. Hercules, CGA, EGA, and VGA graphics are supported. Only one floppy disk drive or one hard disk is required.
PROGRAM FEATURES
- Displays Complete Psych Chart on Computer Screen
- Calculates and Displays Solution for any Psych Problem
- Adjusts for Elevations Between -1000 and 24,000 Feet
- Allows Dry Bulb Temperatures From -40 to 140 F
- Calculates Using English or SI Metric Units
- Uses ASHRAE Psychrometric Equations
- Define State Points with any Two Psych. Parameters
- Allows Labels for State Points on the Chart
- Allows for 7 Different Heating and Cooling Processes
- Automatically Draws Lines Connecting State Points
- Ability to Zoom in on Portions of the Psych Chart
- Provides Charts and Reports On Screen or to the Printer
- Optionally Creates Charts as AutoCAD DXF Files
- Instantaneous Input Error Checking
- Provides Comprehensive and Concise Reports
PROGRAM INPUT
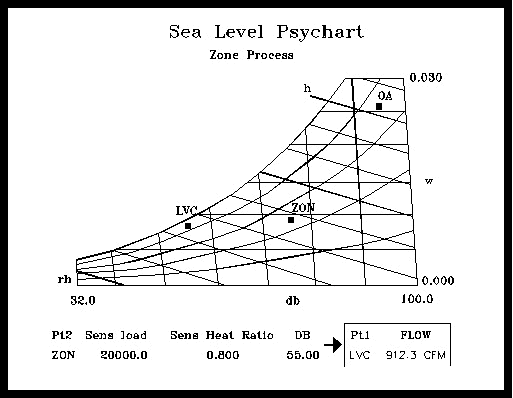
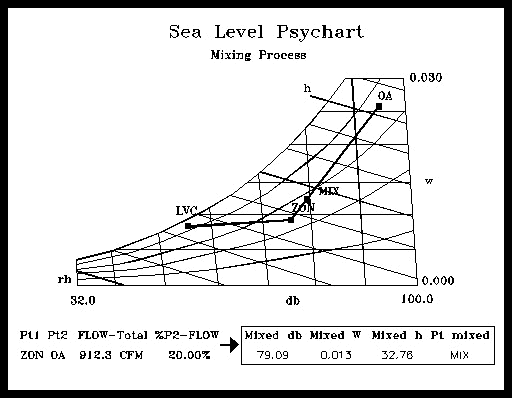
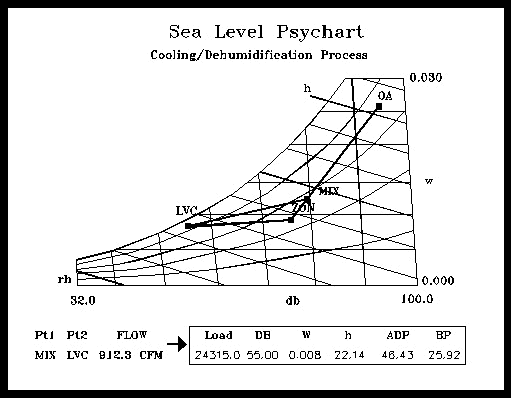
The PsyChart program is completely interactive in that the chart is continuously displayed while menu selections are presented at the bottom of the screen. As selections are made and values entered, the results are immediately displayed on the screen. Menu selections are provided to define, label, and erase state points. A single state point can be defined with any two of the following inputs: dry bulb temp, relative humidity, enthalpy, wet bulb temp, humidity ratio, and dew point. Alternatively, a state point can be defined by using the cursor to locate the position. Seven processes are allowed including: general linear processes, heating, cooling and dehumidification, collection, mixing, and various processes for air as it passes through a zone.
PROGRAM OUTPUT
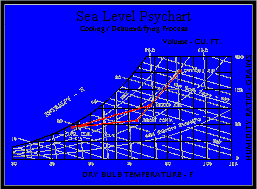
Besides the on-screen display of psych charts, there are five additional reports provided. Two of these reports are partial screen reports (not shown on this flyer) that list limited state point data and air volume data while the pscyh chart is still displayed on the screen. The remaining three reports require the full screen. They are the State Point Report, the Process Energy Report, and the Process Input/Output Report. The State Point Report lists all six psychrometric parameters for all defined state points. The Process Energy Report lists air volume, sensible, latent, and total loads, along with water addition/removal rates for all defined processes. The Process Input/Output Report lists the air volume rates, percentages for mixing and collecting processes, and the input and output state conditions for the processes. These reports occupy the entire screen and provide complete data listings concerning state point conditions, sensible and latent loads encountered from state point to state point, and psychrometric conditions created by each process. Displays of the psych charts can be printed on an Epson and HP Laser compatible printers. Psych Charts can also be plotted by AutoCAD since DXF files can be created. Shown to the left are examples of how the psych chart would appear on your screen as you begin defining state points and processes. Examples of three full screen reports are shown below.


