 |
|||||||||||||||||||||||||||||
|
Elite Software Newsletter
|
September 26th, 2025 |
||||||||||||||||||||||||||||
|
In this Issue |
|
This monthly newsletter will announce new software, tradeshow events, and tips on using existing software. See previous newsletters here. Psychrometric analysis of air is an integral part of HVAC design work. The properties of air and how air can be tempered to comfortable conditions such as 75 °F and 50% relative humidity require a deep understanding of psychrometrics. Using psychrometric software is the easiest way to perform these calculations. Elite Software has just released PsyChart 3.0 Professional for $299 and PsyChart 3.0 Standard for $149. These are Windows based programs that display the psychrometric chart on the computer screen and allow the designer to carry out all operations and analyses normally done using a psychrometric chart on paper. These programs are more than just an electronic display of the standard psych chart. For example, the software can quickly display numerical values of all properties for any selected points on the psych chart. Points on the psych chart can be labeled for future reference, and reports of their properties can be created whenever needed. The software allows for 9 psychrometric processes to be analyzed. The lines for all standard psychrometric processes, such as heating and humidification, cooling and dehumidification, mixing, collecting, etc., are automatically created and displayed on the chart. A major benefit to having the Professional version is that Elite Software Rhvac and Chvac users can import data from those programs. Using the Air Handler import feature, PsyChart 3.0 Professional can import at once all the necessary data to construct a complete cooling process chart for a given system. Another major feature of the professional version is the ability to view and analyze hourly weather data files for over 3,000 cities worldwide. This feature is helpful in finding peak outdoor design conditions, and also for evaluating whether HRV's and outdoor air economizers are appropriate. Click here to see even more details on the PsyChart software and download a trial version. Click here to see how existing PsyChart 2.0 users can upgrade to PsyChart 3.0 Professional. Be sure to check our web site at www.elitesoft.com for even more info. Many programs have received free downloadable updates. Go here to see if there are updates relevant to your software. If you have questions on any topic, please feel free to call 800-648-9523 or 979-690-9420, or send email to info@elitesoft.com. Sincerely, Bill Smith |
|||||||||||||||||||||||||||
Cooling Processes
|
|||||||||||||||||||||||||||||
Summary of Standard vs. Professional Version FeaturesSome HVAC professionals don't need all the advanced features that PsyChart 3.0 Professional provides. PsyChart 3.0 Standard is meant for those designers that need just basic psychrometric analysis capabilities. Below is a table that shows the differences between PsyChart 3.0 Professional and PsyChart 3.0 Standard. Note that anyone can upgrade from PsyChart Standard 3.0 to PsyChart Professional 3.0 at a later date just by paying the difference in price between the two versions.
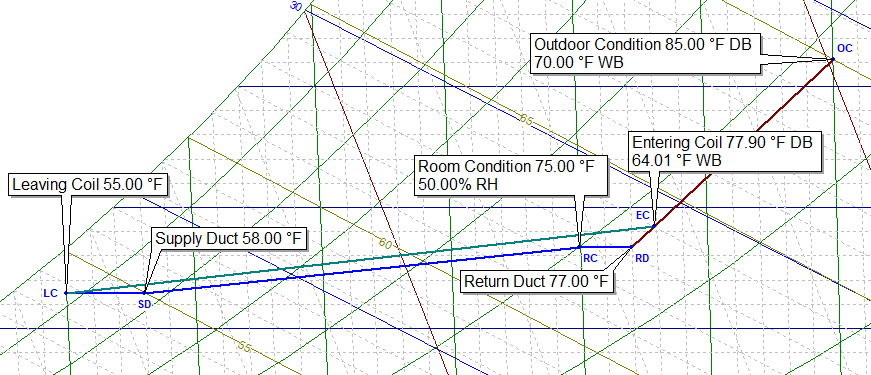
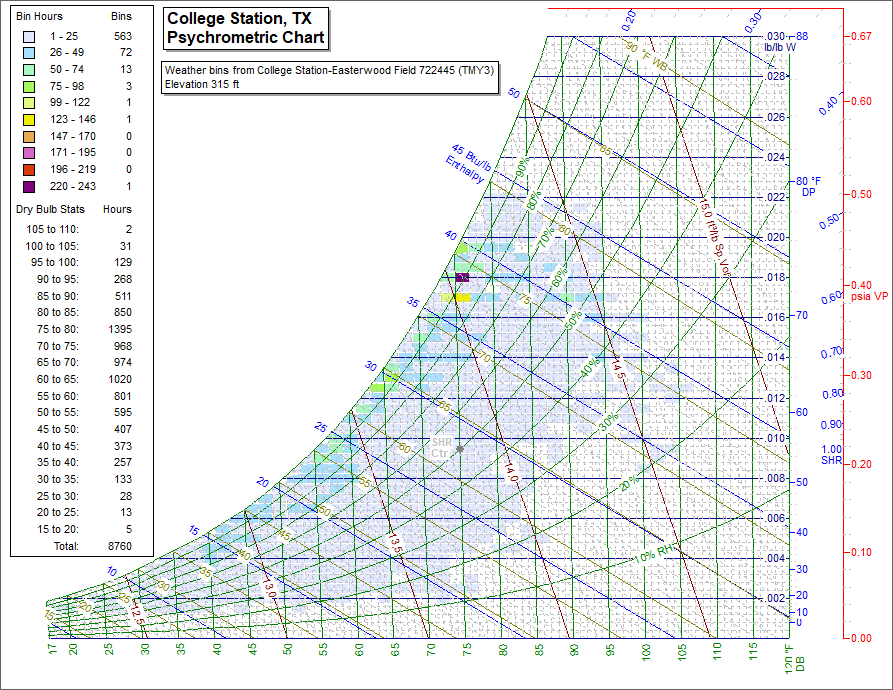
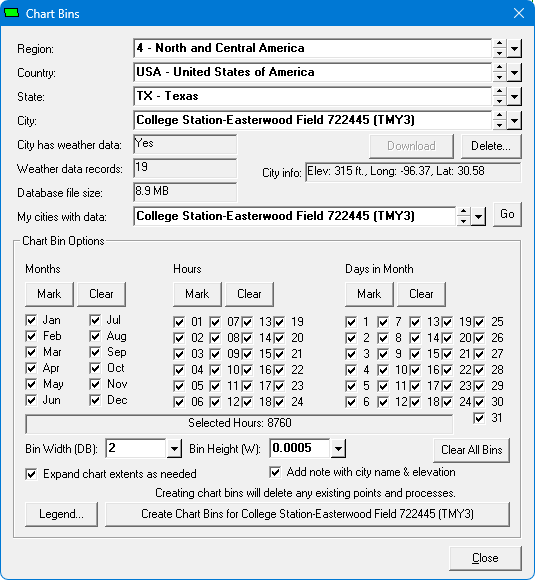
Professional Features Details1. Air Handler Model Window (Professional Version Only): This is a major feature. The standard psychrometric analysis for an HVAC system involves maintaining a desired indoor room condition like 75 F and 50 RH while also having a leaving cooling coil condition near saturation, typically 55 F, and mixing in some outside air with the return air to obtain a mixed air condition before the air enters the cooling coil. This is further complicated if effects from blower fans, ductwork, and HRV devices must be factored in. The air handler model data entry screen allows for all the necessary inputs in one convenient place and then generates the complete air conditioning cycle, as seen here. This same cycle can be created in the standard version as well, but it would take the individual creation of several zone processes, three cooling processes, and one mixing process. 2. Import from Rhvac and Chvac (Professional Version Only): Most of the data needed to fill out the air handler model comes from cooling load calculations. This data would include the specified indoor and outdoor design conditions, the space sensible and latent loads, and the supply cfm (l/s) or the desired leaving coil dry bulb temperature. All of this data can be manually entered, but if you used Rhvac or Chvac to calculate the loads, PsyChart can automatically import all of the data needed without any manual entry required. 3. Import Ability from Data Files (Professional Version Only): Many designers are now using data loggers to record temperature data over a period of time. Oftentimes, problem buildings will have a wide variation in temperatures and humidity throughout the day. If this temperature data can be saved into a CSV (comma separated values) file, it can be imported into PsyChart to create unique state points on a chart. 4. Import Ability from Internet Weather Data (Professional Version Only): Hourly (8,760 hours per year) temperature data is available for over 3,000 cities worldwide from this website https://energyplus.net/weather, but is instantly available in PsyChart for any city just by clicking the Download button for that city, as shown here. This weather data is primarily used for building energy operating cost calculations but it is also useful for evaluating whether various air treatment devices like HRV's and outdoor air economizers can be used successfully. A designer can also interrogate this data for any given city to see appropriate outdoor design conditions for HVAC load calculations. This weather data is arranged in many different formats such as tmy, tmy2, tmy3, iwec, swera, and etmy, and it is provided in several file types including ddy, epw, and stat. These weather data files are not easy to deal with, as specialized software is needed. PsyChart is one of the few programs available that allows you to view and analyze this data. 5. Temperature Data Shown in Chart Bins (Professional Version Only): An efficient way to review the weather data for a city over a year, a month, a week, or even a single day is to use the concept of temperature bins. Traditionally, temperature bins are created in 5 F degree increments and each 5 degree bin contains the number of hours that the temperature occurred in that range. Generally, a designer wants to see where the temperatures are clustered for a given design situation. PsyChart allows the user to create bins on 0.5, 1, 2, 3, 4, 5, or 6 degree increments. In addition, the designer can assign colors for the bins. Viewing weather data broken out into colored bins on a psych chart is a great way to analyze the weather data for a given city. See an example here. 6. Custom Zones (Professional Version Only): The most well known psych chart "zone" is the ASHRAE comfort zone. This comfort zone is basically a rectangular area on the psych chart where indoor occupants generally consider themselves comfortable. It is an area bounded by an upper and lower dry bulb temperature and a minimum dew point temperature and a maximum wet bulb temperature. Making sure actual indoor conditions fall within the ASHRAE comfort zone is an important design criteria. As such, every chart displayed in PsyChart (both standard and professional) allows the display of the ASHRAE comfort zone. In addition, slight user modifications to the comfort zone boundaries are allowed as well. See an example here that shows the ASHRAE comfort zone. But besides a comfort zone for people, many industrial processes also have a sweet spot for production that can be bound not just by dry bulb temperatures but also by properties like relative humidity, absolute humidity, and wet bulb temperatures. Manufacturing processes related to semiconductors, sensitive electronics, and pharmaceuticals are very temperature and humidity sensitive, often requiring low humidity. Other situations like a greenhouse or commercial bread maker requires a humid environment with 75-80% RH. See an example here. Thus, a custom zone capability showing allowable tight tolerances can be very useful when designing those types of specialized HVAC systems. PsyChart allows the creation of numerous custom zones to be shown on the psych chart. 7. Point Groups (Professional Version Only): As mentioned above, sometimes designers have a stream of temperature data that they want to show on a psych chart. In order to manipulate this temperature data effectively, PsyChart allows the creation of point groups. By assigning points to a particular group, the designer can make them all a uniform color or make them appear or disappear on a chart without having to delete them. An example use of point groups would be to show a wide scatter group of points recorded from a project with poor temperature control. The wide scatter points might all appear in red. A second group of points taken after temperature control was improved might appear in green and be shown on the same chart in a much tighter spread indicating that the indoor temperature was well controlled compared to the initial wide scatter of points. |
|||||||||||||||||||||||||||||
| Copyright @ 2025 Elite Software
Development, Inc. Elite Software Development, Inc. | 2700 Arrington Road | College Station | TX | 77845 |
|||||||||||||||||||||||||||||
 National Comfort Institute recommends Elite Software for High Performance Contractors
Unsubscribe instantly from these emails by clicking here.