Overview
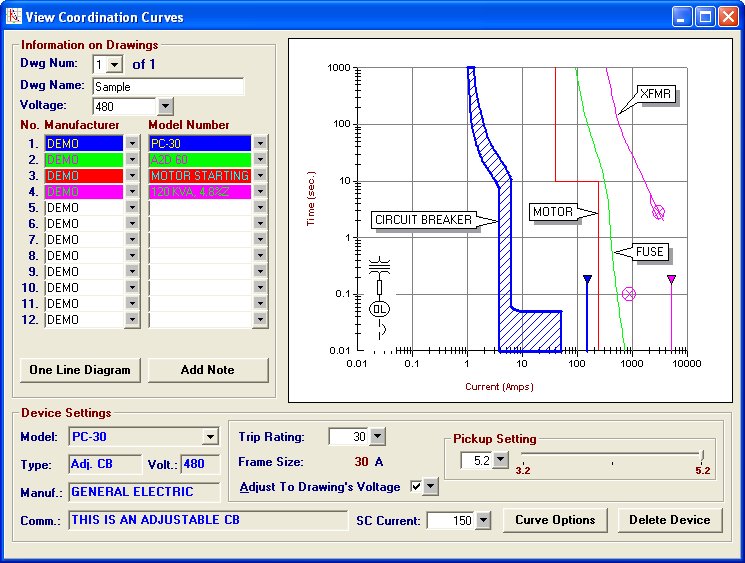
The Elite Software E-Coord Program aids in the selective coordination of fuses and circuit breakers by providing an instantaneous review of their time-current curves in a proposed electrical protection system. Besides revealing curve overlaps, E-Coord can also analyze the melting and clearing I²T value of every fuse and determine if any time-current overlaps exist that cannot be seen on a plot. E-Coord is supplied with a library of over 2,000 protection devices from numerous manufacturers. Thousands of additional devices can be easily added. All types of fuses and breakers can be analyzed as well as motor starting, transformer, and cable damage curves. Many devices also have special switch settings that allow for curve adjustments. Curves can be quickly viewed in combination on the computer screen, or drawn on a printer. Up to 24 drawings, each with up to 12 curves and a one-line diagram can be plotted per project. Each curve can be assigned its own label, hatch pattern, and color.
Calculation Method
The E-Coord Program uses a cubic spline method for creating precise curves given time and current data points for any given electrical protection device. These curves are saved in separate library manufacturer files where they are readily available for quick plotting to the screen or printer.
Program Input
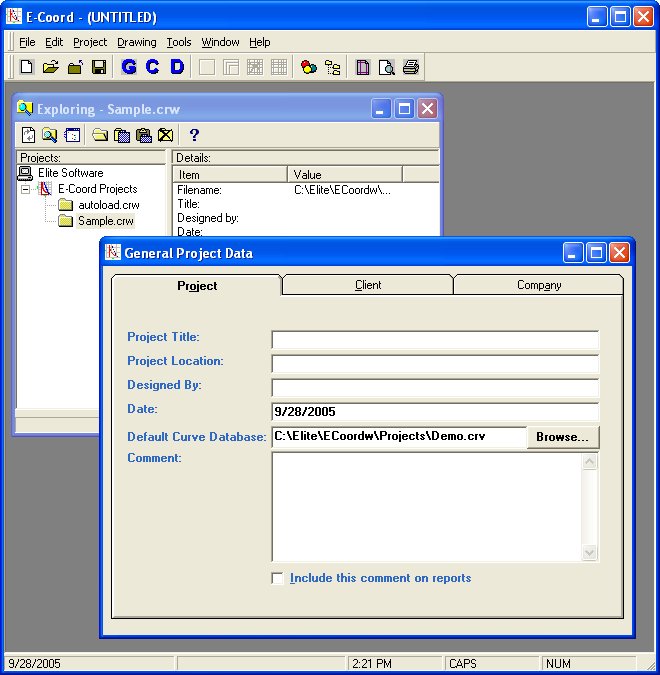
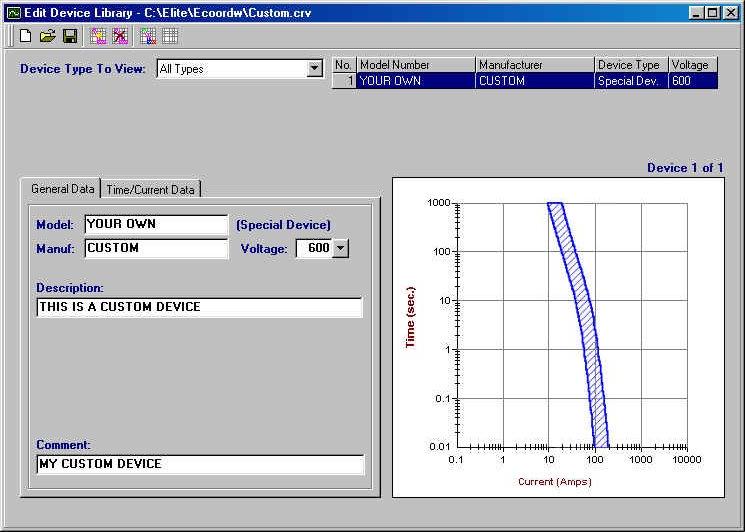
Two types of data are requested: general project data and drawing data. The general project data includes the project name and location, the client name, designer's name. Each drawing can have up to 12 device curves and a one-line diagram shown on it. E-Coord is supplied with over 2,000 devices divided up over nine manufacturers such as Gould Shawmut, GE, Square D, Bussmann, and others. It is easy to add, revise, and delete devices to the manufacturer library files. Devices allowed include fuses, circuit breakers (all types), and overcurrent relays. There is also provision for cable damage, transformer inrush and withstand, and motor starting curves. Displaying a device curve requires only entering the device model number. More data is required to add a device to the library. Fuses, for example, can have an average time-amp curve or both a minimum melt and total clearing curve. For electronic circuit breakers a base time-amp curve is needed along with information on the instant pickup, long and short time pickup, and long and short time delay.
Printing and Reports
E-Coord provides the following six basic output reports: project summary, general drawing data, drawing summary, detailed drawing data, time/current data, and drawings of curve coordination plots. All reports can be printed. The curves can be plotted on the screen or printer. You can specify exactly which reports are to be printed.