Overview
The PsyChart program colorfully displays the psychrometric chart on the computer screen in full detail and allows the designer to carry out all operations and analysis normally done using a conventional psychrometric chart. However, PsyChart is more than an electronic display of the standard psych chart. For example, it can quickly display numerical values of all properties for any selected point on the psych chart. Points and processes on the psych chart can be labeled for future reference, and reports of their properties can be displayed on the screen or printer. The lines for all standard psychrometric processes, such as heating and humidification, cooling and dehumidification, mixing, collecting, etc., are automatically calculated and displayed on the chart. Points can be manually placed or imported in from an external data file. Weather data from over 3,000 cities worldwide can be imported as well.
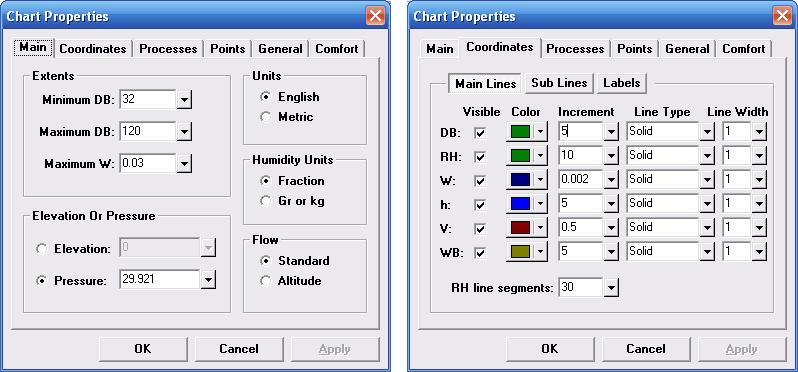
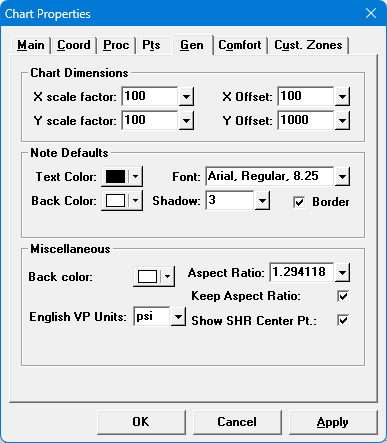
Although the initial display is the standard ASHRAE sea-level chart, this can be changed by the user to show a chart for any elevation or pressure, and for any range of dry bulb temperatures up to 200 F. The user can further customize the psych chart by specifying to show or omit any of the property lines which can be displayed with either Imperial or SI metric units. In order to view sections of the psych chart in fine detail, PsyChart allows the user to zoom in and create an expanded window around the selected region of the psych chart. Zooming in enhances the clarity of processes where state points tend to crowd together.
PsyChart uses weather data in several ways. One is to provide temperatures for state point locations after being imported. Another use is for reviewing weather data in order to determine the best outdoor design conditions for a particular location for use in load calculation programs. Still another use of the weather data review in PsyChart is to use the bin analysis view to see whether a particular location is a good candidate for outdoor air economizers or whether additional dehumidification systems are needed. See more on how weather data is used below.
Calculation Method
The PsyChart program uses the psychrometric equations for moist air in Chapter 6 of the ASHRAE Handbook of Fundamentals. Rapidly converging iteration techniques have been employed to allow PsyChart to solve problems with virtually any combination of input parameters.
Program Input
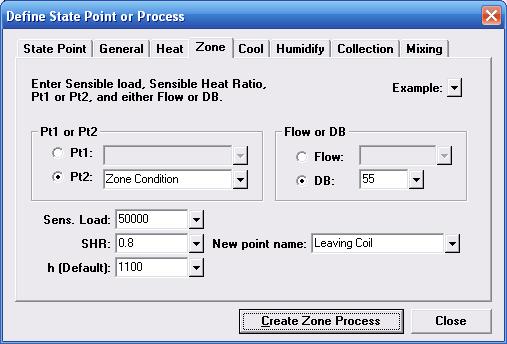
The PsyChart program is completely interactive in that the chart is continuously displayed and updated as data is entered. A single state point can be defined with any two of the following inputs: dry bulb temp, relative humidity, enthalpy, wet bulb temp, humidity ratio, and dew point. Alternatively, a state point can be defined by using the cursor to locate the state point position on the chart. Additionally, state points can be defined by importing temperature data. Besides defining state points, the following nine different processed can be calculated for: General Linear, Sensible Heating, Zone, Cooling/Dehumidification, Humidification, Heat-And-Humidify, Mix-And-Humidify, Collection, and Mixing. Each of these processes can be initiated with various combinations of data involving state points and other data.
Program Output
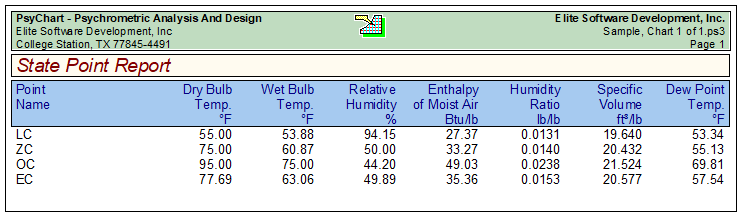
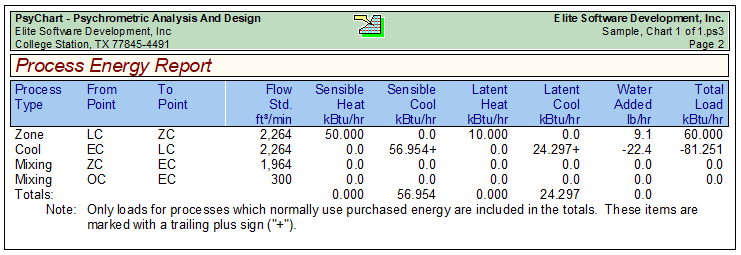
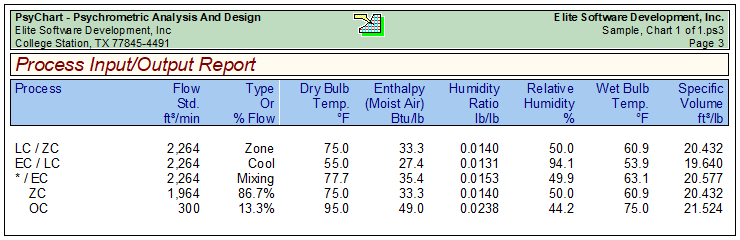
Besides the on-screen display of psych charts, there are three additional reports provided. They are the State Point Report, the Process Energy Report, and the Process Input/Output Report. The State Point Report lists all six psychrometric parameters for all of the defined state points. The Process Energy Report lists air volume, sensible, latent, and total loads, along with water addition/removal rates for all defined processes. The Process Input/Output Report lists the air volume rates, percentages for mixing and collecting processes, and the input and output state conditions for the processes. These reports provide complete data listings concerning state point conditions, sensible and latent loads encountered from state point to state point, and the psychrometric conditions created by each process. See some sample reports here.
Summary of Standard vs. Professional Version Features
Some HVAC professionals don't need all the advanced features that PsyChart 3.0 Professional provides. PsyChart 3.0 Standard is meant for those designers that need just basic psychrometric analysis capabilities. Below is a table that shows the differences between PsyChart 3.0 Professional and PsyChart 3.0 Standard. Note that anyone can upgrade from PsyChart Standard 3.0 to PsyChart Professional 3.0 at a later date just by paying the difference in price between the two versions.
FEATURE |
STANDARD |
PROFESSIONAL |
| Air Handler Model window |
No |
Yes |
| Import Ability from Chvac and Rhvac |
No |
Yes |
| Import Ability from Data Files |
No |
Yes |
| Import Ability from Internet Weather Data |
No |
Yes |
| Chart Bins |
No |
Yes |
| Custom Zones |
No |
Yes |
| Point Groups |
No |
Yes |
| All Other Features |
Yes |
Yes |
Professional Features Details
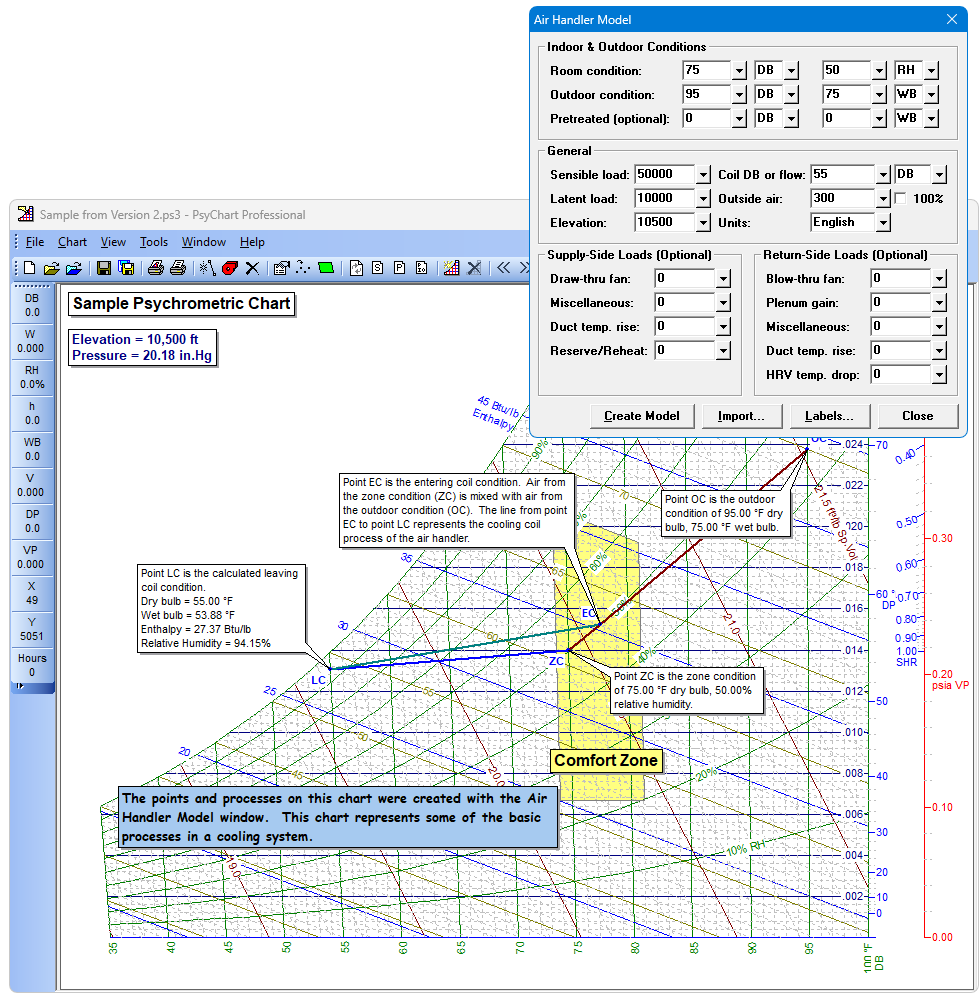
1. Air Handler Model Window (Professional Version Only): This is a major feature. The standard psychrometric analysis for an HVAC system involves maintaining a desired indoor room condition like 75 F and 50 RH while also having a leaving cooling coil condition near saturation, typically 55 F, and mixing in some outside air with the return air to obtain a mixed air condition before the air enters the cooling coil. This is further complicated if effects from blower fans, ductwork, and HRV devices must be factored in. The air handler model data entry screen allows for all the necessary inputs in one convenient place and then generates the complete air conditioning cycle, as seen here. This same cycle can be created in the standard version as well, but it would take the individual creation of several zone processes, three cooling processes, and one mixing process.
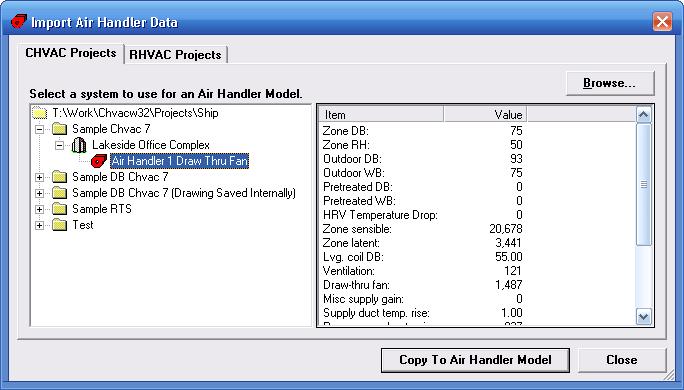
2. Import from Rhvac and Chvac (Professional Version Only): Most of the data needed to fill out the air handler model comes from cooling load calculations. This data would include the specified indoor and outdoor design conditions, the space sensible and latent loads, and the supply cfm (l/s) or the desired leaving coil dry bulb temperature. All of this data can be manually entered, but if you used Rhvac or Chvac to calculate the loads, PsyChart can automatically import all of the data needed without any manual entry required.
3. Import Ability from Data Files (Professional Version Only): Many designers are now using data loggers to record temperature data over a period of time. Oftentimes, problem buildings will have a wide variation in temperatures and humidity throughout the day. If this temperature data can be saved into a CSV (comma separated values) file, it can be imported into PsyChart to create unique state points on a chart.
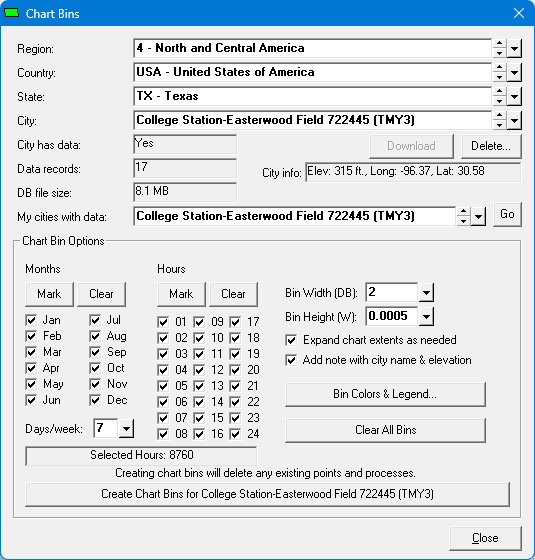
4. Import Ability from Internet Weather Data (Professional Version Only): Hourly (8,760 hours per year) temperature data is available for over 3,000 cities worldwide from this website https://energyplus.net/weather, but is instantly available in PsyChart for any city just by clicking the Download button for that city, as shown here. This weather data is primarily used for building energy operating cost calculations but it is also useful for evaluating whether various air treatment devices like HRV's and outdoor air economizers can be used successfully. A designer can also interrogate this data for any given city to see appropriate outdoor design conditions for HVAC load calculations. This weather data is arranged in many different formats such as tmy, tmy2, tmy3, iwec, swera, and etmy, and it is provided in several file types including ddy, epw, and stat. These weather data files are not easy to deal with as specialized software is needed. PsyChart is one of the few programs available that allows you to view and analyze this data.
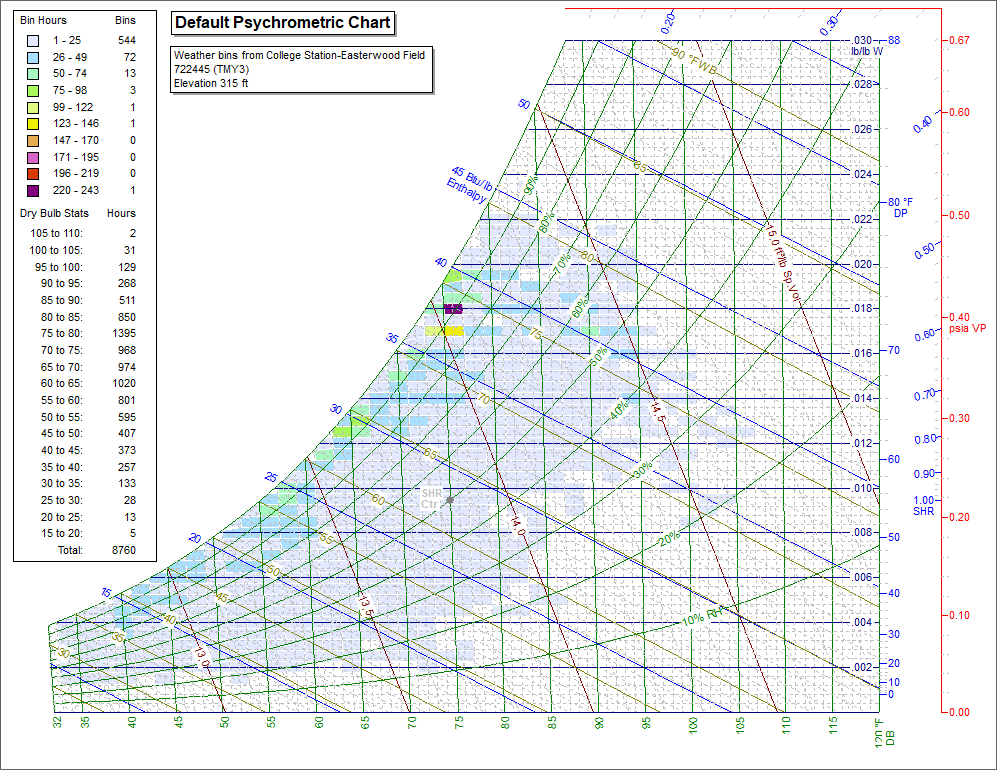
5. Temperature Data Shown in Chart Bins (Professional Version Only): An efficient way to review the weather data for a city over a year, a month, a week, or even a single day is to use the concept of temperature bins. Traditionally, temperature bins are created in 5 F degree increments and each 5 degree bin contains the number of hours that the temperature occurred in that range. Generally, a designer wants to see where the temperatures are clustered for a given design situation. PsyChart allows the user to create bins on 0.5., 1, 2, 3, 4, 5, or 6 degree increments. In addition, the designer can assign colors for the bins. Viewing weather data broken out into colored bins on a psych chart is a great way to analyze the weather data for a given city. See an example here.
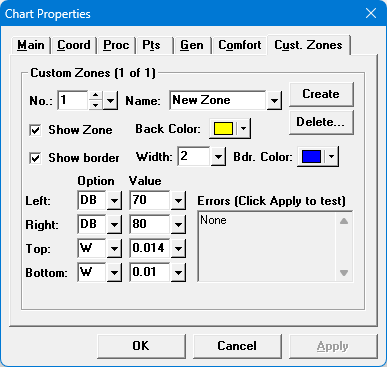
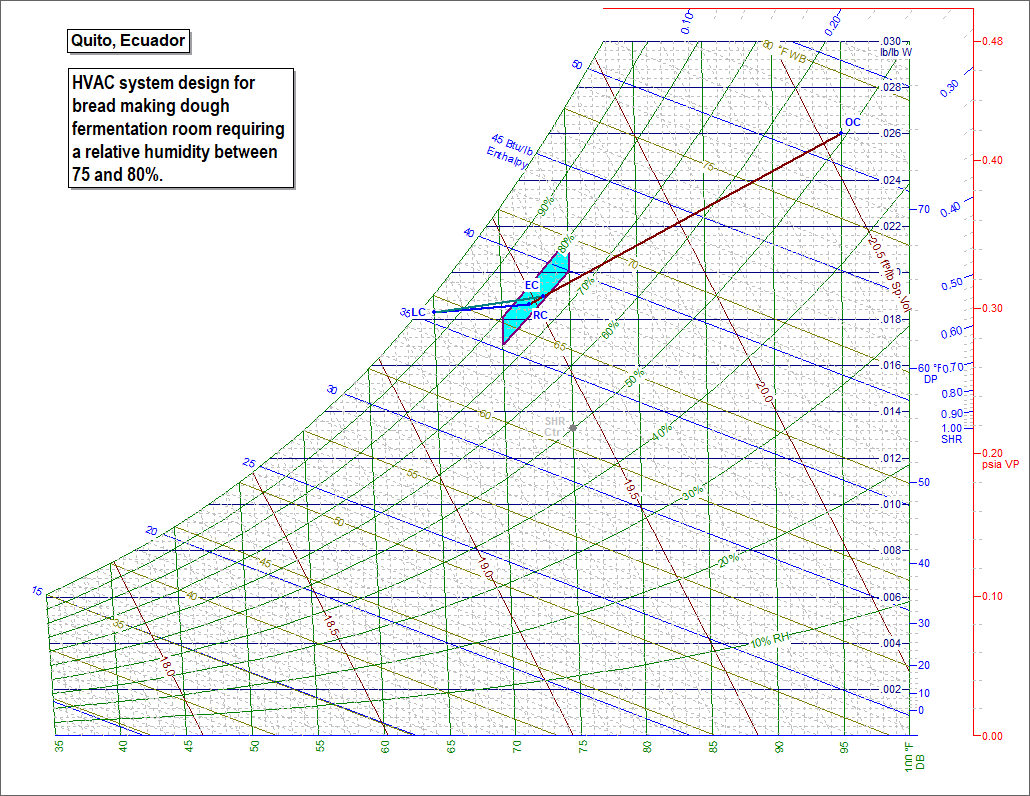
6. Custom Zones (Professional Version Only): The most well known psych chart "zone" is the ASHRAE comfort zone. This comfort zone is basically a rectangular area on the psych chart where indoor occupants generally consider themselves comfortable. It is an area bounded by an upper and lower dry bulb temperature and a minimum dew point temperature and a maximum wet bulb temperature. Making sure actual indoor conditions fall within the ASHRAE comfort zone is an important design criteria. As such, every chart displayed in PsyChart (both standard and professional) allows the display of the ASHRAE comfort zone. In addition, slight user modifications to the comfort zone boundaries are allowed as well. See an example here that shows the ASHRAE comfort zone. But besides a comfort zone for people, many industrial processes also have a sweet spot for production that can be bound not just by dry bulb temperatures but also by properties like relative humidity, absolute humidity, and wet bulb temperatures. Manufacturing processes related to semiconductors, sensitive electronics, and pharmaceuticals are very temperature and humidity sensitive, often requiring low humidity. Other situations like a greenhouse or commercial bread maker requires a humid environment with 75-80% RH. See an example here. Thus, a custom zone capability showing allowable tight tolerances can be very useful when designing those types of specialized HVAC systems. PsyChart allows the creation of numerous custom zones to be shown on the psych chart.
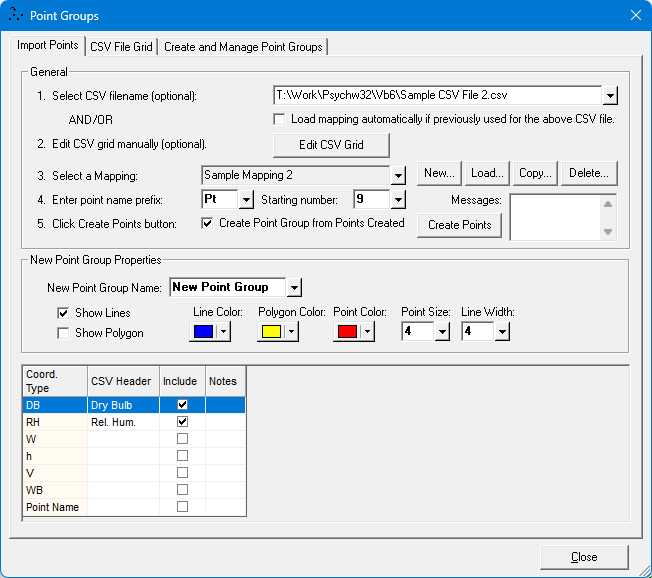
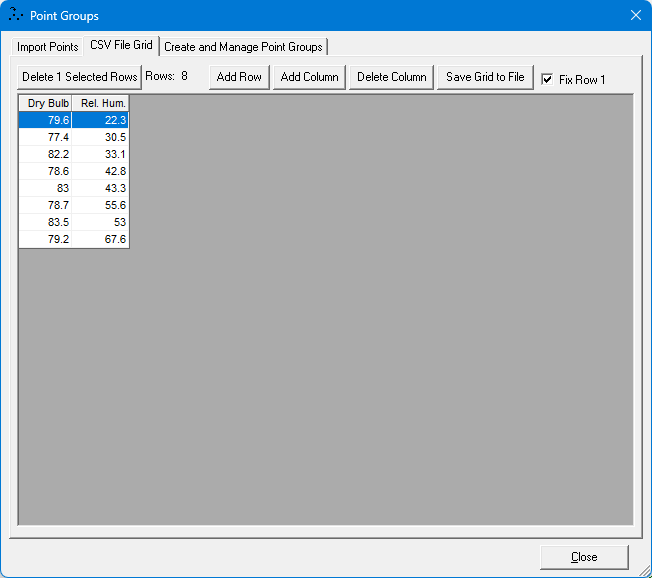
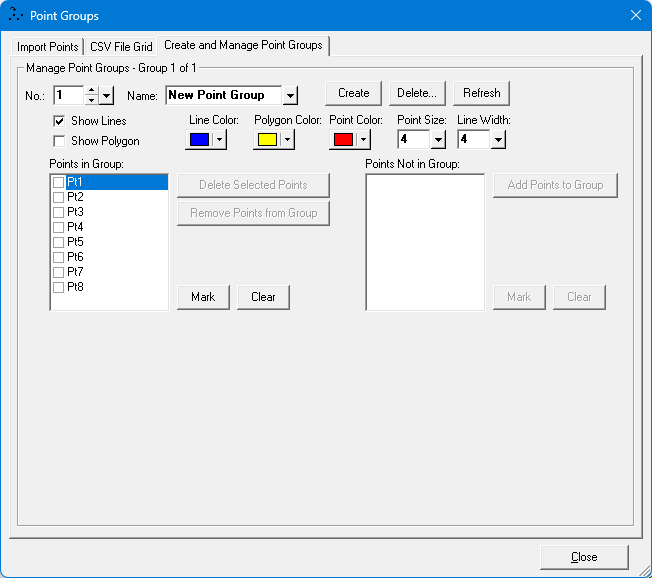
7. Point Groups (Professional Version Only): As mentioned above, sometimes designers have a stream of temperature data that they want to show on a psych chart. In order to manipulate this temperature data effectively, PsyChart allows the creation of point groups. By assigning points to a particular group, the designer can make them all a uniform color or make them appear or disappear on a chart without having to delete them. An example use of point groups would be to show a wide scatter group of points recorded from a project with poor temperature control. The wide scatter points might all appear in red. A second group of points taken after temperature control was improved might appear in green and be shown on the same chart in a much tighter spread indicating that the indoor temperature was well controlled compared to the initial wide scatter of points.
Functional Demo
PsyChart can be downloaded as a functional demo in order to test its features. The demo will work with the full professional features with the exception that the chart elevation is limited to 9,500 ft. to 11,000 ft. All features will work as normal except that the results are skewed from what they would be at lower elevations. Psychrometric processes calculated for high elevations use much less dense air, and this changes the results significantly. In addition, weather data can not be downloaded and viewed with the demo except for cities at 9,500' of elevation or higher. Be careful to remember that results from the PsyChart demo are not valid unless your project happens to be located 9,500' above sea level. If you decide to license the software, a license file will be emailed to you that removes the elevation limit from the software and sets the software to professional or standard capability according to what your ordered.
New Features in Professional Version 3.0 Above PsyChart 2.0 (Screenshots)
Registered users of the previous PsyChart 2.0 software are able to upgrade to PsyChart 3.0 Professional with a discount price from retail. See the upgrade pricing here. PsyChart 2.0 is more powerful in some ways than the standard version of PsyChart 3.0, so the upgrade path is only offered from PsyChart 2.0 to PsyChart 3.0 Professional. See the new features in the PsyChart 3.0 Professional version below that are above what PsyChart 2.0 provided.
- Zoom and pan the chart with the mousewheel.
- New coordinates lines added to the chart: dewpoint, vapor pressure, and sensible heat ratio.
- New Keep Aspect Ratio option which keeps the chart at an aspect ratio appropriate for 8.5 x 11 paper, or any aspect ratio you choose.
- Import temperature data from external data files
- Import temperature data from internet weather data sites. The weather data for about 3,000 cities throughout the world can be downloaded within the program.
- Chart Bins window, which lets you add bin rectangles with various colors to the chart that represent the number of hours that occurred in each temperature bin of the selected city. A legend can be shown on the chart for the number of hours each of the bin colors represents, as well as dry bulb statistics for the selected city.
- Chart Properties now includes a User Defined Custom Zones tab to go along with the standard ASHRAE comfort zone
- Point Groups window lets you assign points into multiple Point Groups with various settings for each group